Hi, I’m Dave! I began a foray into Data Science / Social Network Analysis (SNA) studies yesterday and felt it past time to get my hands dirty. Please feel free to connect on Twitter!
Methodology
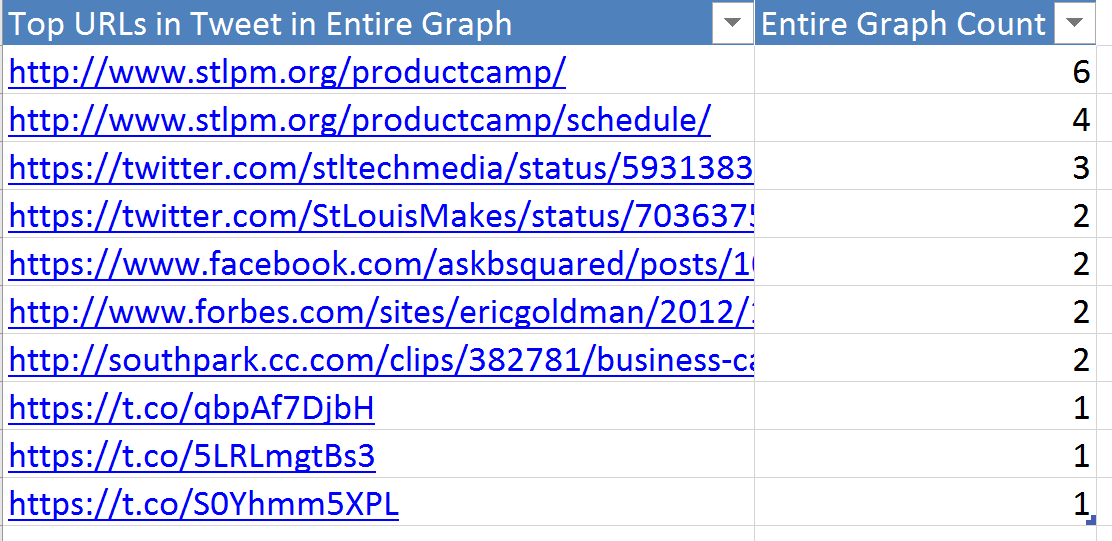
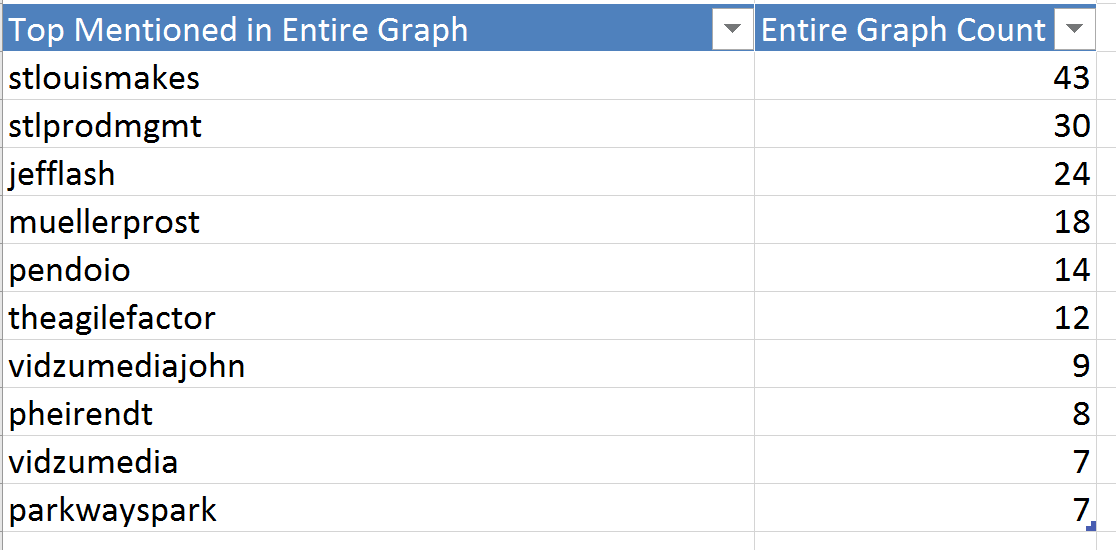
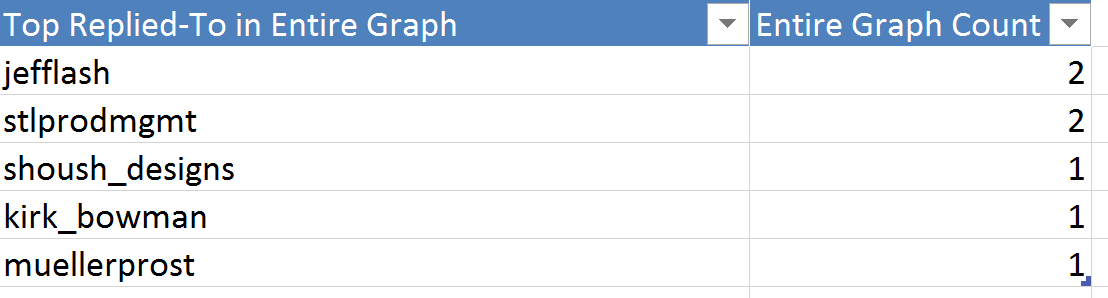
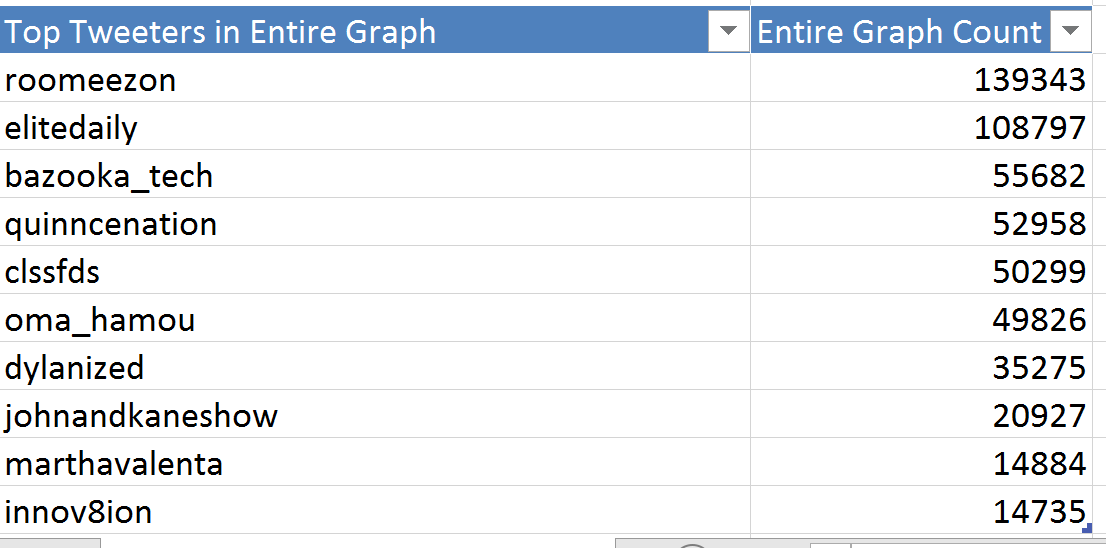
I’m utilizing NodeXL Pro, a Microsoft Excel Template, to import Twitter data including the #PCSTL hashtag. Please look at raw data and graphs in my Google Drive folder for STL Product Camp. You may wish to install NodeXL Basic (free, open source)and Gephi (free, open source graphics viz) for deeper analysis.
Key Graph Theory Terms
Below are some of the concepts I focused on for analysis but you can check out this graph theory glossary on Wikipedia for a deeper dive.
- Vertices: Nodes or entities in a network. In this case, they’re Twitter accounts.
- Edges: Connections between nodes in a network.
- In-Degree: Generally, one measure of an entity’s (vertex) influence and illustrated by the # of flows (edges) from a given entity to the subject entity in a network. The higher one’s In-Degree, the more influence they likely have.
- Out-Degree: A measure of flows from the subject entity to other entities in the network. For example, people with greater influence tend to generate valued ideas that they altruistically share with others.
Product Camp Findings
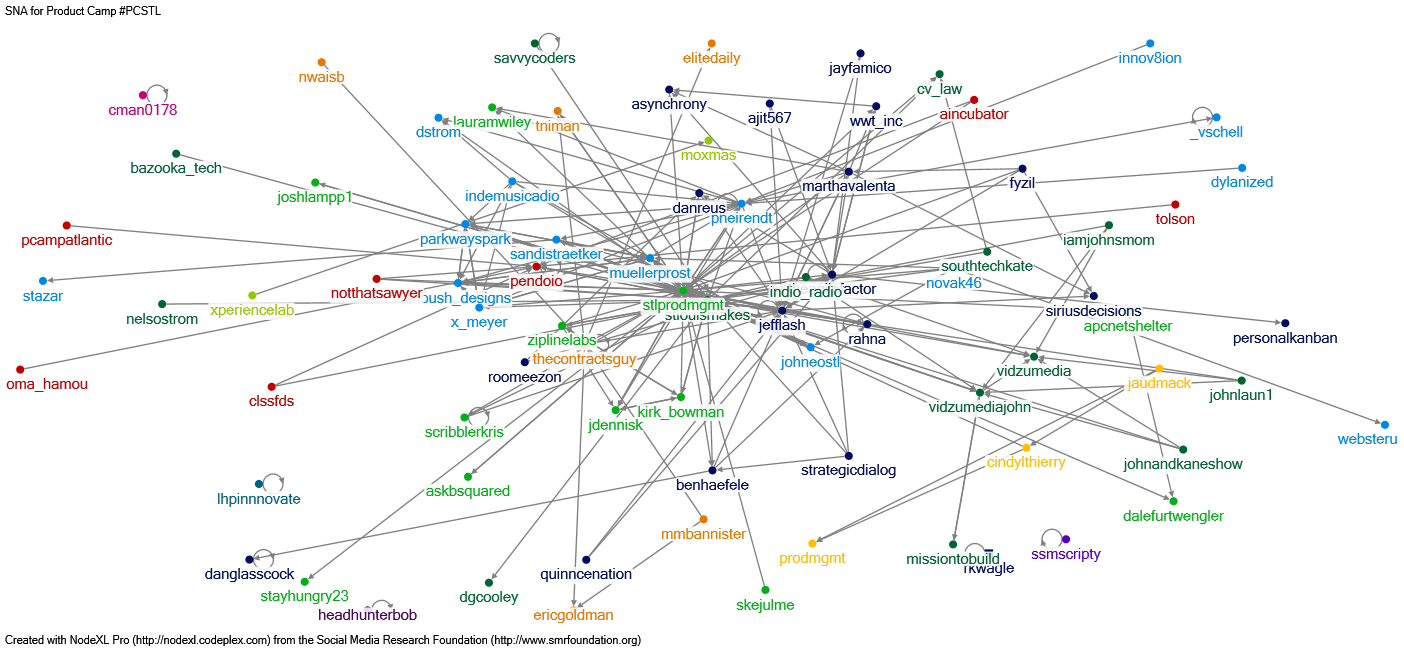
Below is the social network graph with labeled entities (Twitter accounts). Note that entities with greater influence (most connections) are centered.
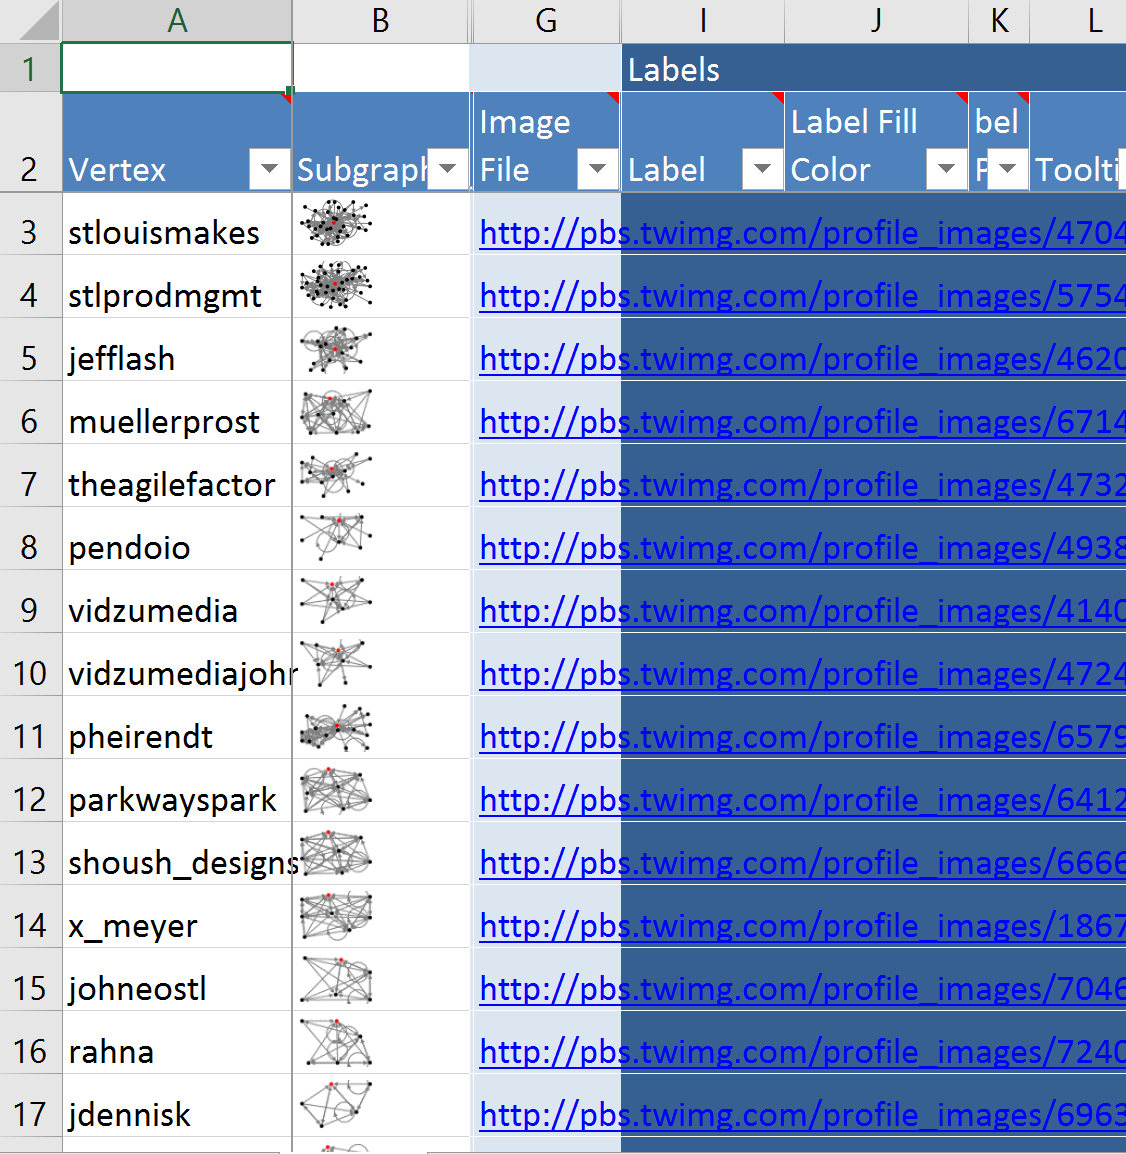
In the table directly below, pay attention to each vertices’ (Twitter account) subgraph (a view of their edges that includes in-degree and out-degree). I’ve sorted this chart by in-degree which is one function of influence.
Groupings (Clustered via Clauset-Newman-Moore algo)
- Check the Group Vertices tab in the excel spreadsheet and you’ll notice 13 distinct clusters and the Twitter accounts that comprise them. I haven’t studied this yet but intuition suggests they’re a function of vertex adjacency (strong ties?).